
Let’s be real, when you’re pushing past 7-figures, even tiny leaks in your landing pages can quietly drain thousands from your bottom line.
That’s why tracking the right landing page KPIs isn’t just “nice to have.” It’s survival.
But here’s the trap: not all metrics actually matter.
If you’re still obsessing over surface-level stats like “bounce rate” or “time on page,” your odds of scaling are as good as Hawkeye beating Hulk in a fistfight.
Now, if you want to scale like a savage, you need to zero in on the KPIs that actually move money. The ones that scream, “Fix me or bleed revenue.”
In this article, we’re going to hand you the 5 landing page metrics that every serious 7-figure brand should be obsessed with. Track these like a hawk, and you’ll stop leaving cash on the table and start converting like crazy.
TLDR;
Here are the KPIs every 7-figure brand should be tracking (but most aren’t):
- Revenue Per Visitor (RPV): The Holy Grail of A/B Testing
- Drop-Off Rate: Your Funnel’s Biggest Red Flag
- AOV: Squeeze More Cash from Every Purchase
- Incremental Uplifts: The Small Wins That Stack Fat Profits
- CAC & LTV: Go Right or Go Broke
⚡ KPI 1: Revenue Per Visitor – The Holy Grail of A/B Testing
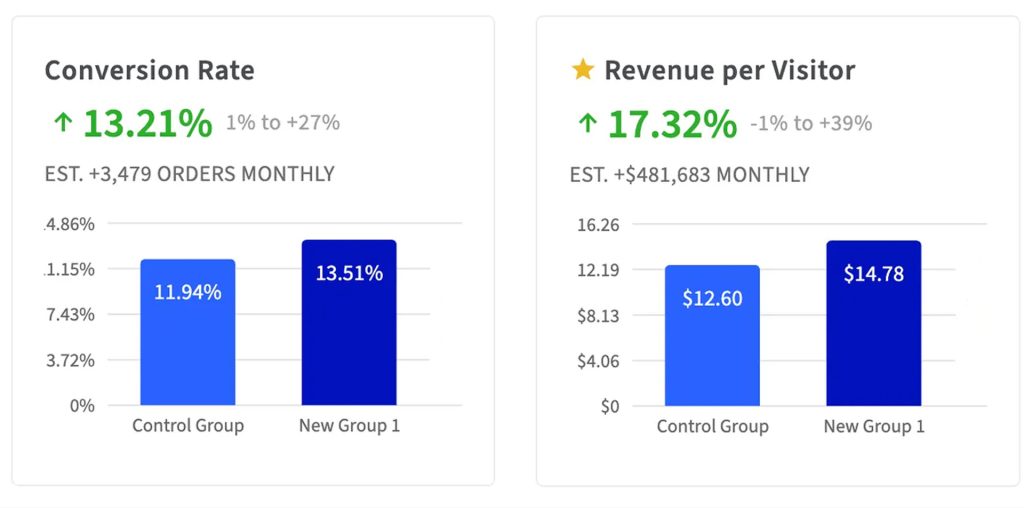
You want to know if your landing page, funnel, or site is actually pulling its weight?
Look at Revenue Per Visitor (RPV).
It’s simple: take your total revenue, divide it by the number of unique visitors and boom! Now you know exactly how much money each person who lands on your page is worth.
So if you had 2,000 visitors and $10,000 in revenue, that’s $5 per visitor. Easy math. Big insight.
Think of RPV as the lovechild of your conversion rate and average order value (AOV) and trust us, it’s the only “baby” in your funnel worth obsessing over!
Why RPV Matters (More Than You Think)
One glance at RPV tells you: Are we making money? Is this page a beast… or a dud?
If you’re running ads, testing audiences, or juggling multiple landing pages, RPV slices through the mess like a samurai sword. You’ll know what to scale, what to tweak and what to kill.
Formula: RPV = Total Revenue ÷ Total Visitors (or Sessions)
Want to measure total marketing horsepower? Use sessions. Want to know how good your site is at converting actual people? Use unique visitors.
Show Me the Money: Page A vs. Page B
Let’s bring this metric to life. Suppose you’re testing two different landing page strategies for an e-commerce site. Page A has a product description that highlights affordability and fast results, whereas Page B’s product description emphasises its superiority over competitors.
Here are the results:
| Page A | Page B |
| Converts 5% of visitors | Converts 3% |
| AOV = $50 | AOV = $100 |
| RPV = 0.05 × $50 = $2.50 | RPV = 0.03 × $100 = $3.00 |
Page A gets more people to buy, but Page B makes you $0.50 per visitor.
That extra $0.50 might feel small… until you scale. Over 100,000 visitors, that’s $50,000 more in revenue. Same traffic, better returns, just by choosing the right page!
This is why RPV matters. If you’re only watching conversion rate, Page A looks like the hero. But more buyers doesn’t always mean more money.
RPV gives you the full picture. It tells you who’s not just saying “yes, I’ll buy this” but who’s says, “yes, I’ll buy this, and this, and this!”.
Ignore it, and you could end up scaling a page that burns ad spend without boosting revenue. Track it, and you know exactly where the money’s coming from and how to get more of it.
Want to Boost RPV? Test These (One at a Time!)
- 🔥 Refine your messaging: Hit pain points hard. Position your offer as the “hell yes” solution.
- 💎 Clarify your offer: Confused visitors don’t buy. Make your value stupidly obvious.
- 🛡️ Build trust instantly: Add in reviews, guarantees and social proof to remove doubt fast.
- 🎯 Upgrade your creatives: Stronger visuals. Better CTAs. Cleaner layouts. Go from “meh” to magnetic.
So, don’t throw spaghetti at the wall. Test smart. Test surgically. Test for RPV.
⚡ KPI 2: Drop-Off Rate – Your Funnel’s Biggest Red Flag
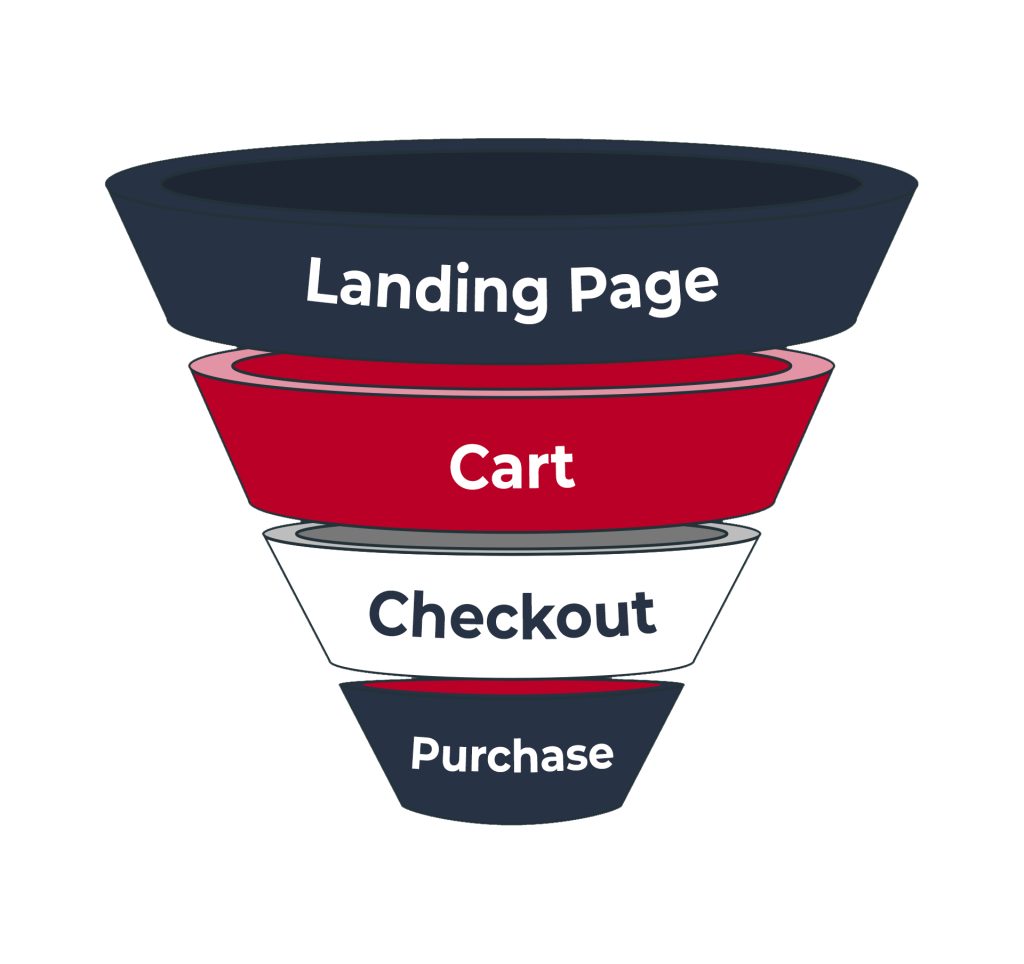
Let’s talk about one of the sneakiest conversion killers in your funnel: drop-off.
Drop-off = the moment a potential customer bails before taking the next step.
Doesn’t click. Doesn’t add to cart. Doesn’t check out.
Gone.
Every time that happens, your funnel is leaking profit. And if you don’t know where it’s happening, you can’t fix it!
The 4 Drop-Off Danger Zones
Here’s where most funnels break harder than a dollar-store toy:
1. The Ghost Town Landing Page
First impressions? Make or break. If users are bouncing right after the first page loads, you’ve already lost. Could be your site’s slow as molasses. Could be your content’s as relevant as a flip phone in 2025.
If this is the case, you need to learn how to create a landing page that converts like crazy.
2. Product Page With Low ‘Add to Carts’? That’s a Yikes.
So they stuck around… but didn’t click that sweet little CTA? Yeah, that’s a product-page drop-off.
Biggest culprit? Weak offers. If your offer doesn’t slap hard enough to make them act, you’re just window dressing.
3. Cart? Full. Checkout? Never Happened.
Cart abandonment is the Bermuda Triangle of eCom. Around 70% of shoppers abandon their carts. Why?
Surprise fees. Forced account signups. Or they just get cold feet because your cart page feels sketchier than a back-alley deal.
4. The Checkout Gauntlet
You’ve got them SO close to the finish line… and then your checkout form is longer than the director’s cut of Lord of the Rings, with commentary.
STOP IT.
Every extra field is a landmine. Each one is a reason to bail.
Plug The Leaks
Want to keep more visitors moving through your funnel instead of bailing halfway? Then it’s time to seal the cracks and smooth the path.
If your bounce rate’s too high or nobody’s clicking “Add to Cart,” start with your landing page.
We break it all down in 11 Steps to Create eCom Landing Pages that Convert Like Crazy.
But if they’re dropping off after adding to cart, or during checkout, then follow these steps:
🛒 Cart → Checkout
- No surprises: Show all shipping costs, taxes, and fees before they hit checkout. Hidden costs = instant exit.
- Ditch the signup wall: Let people checkout as guests or sign in with Google/Facebook/Apple.
- Add trust signals: Security icons, guarantees and reviews should be visible right in the cart so you build their trust.
- Use a cart drawer: Don’t bounce them to a whole new page. Keep it light, fast and smooth.
💳 Checkout → Purchase
- Strip it down: Only ask for what you absolutely need in the form.
- Speed things up: Offer PayPal, Apple Pay, Shop Pay, whatever makes it easy to pay and bounce.
- Clean design, mobile-first: The Baymard Institute says better checkout design = 35% more sales. That’s not a stat. That’s a goldmine.
Oh, and if they STILL ghost you? Hit them with a cart recovery email so good, they feel FOMO in their soul.
In the end, drop-off rate is all about finding where your visitors are falling out of the journey and then taking action to fix those choke points.
By tracking drop-off at each stage, you’re acting like a detective for your website, uncovering whether it’s the landing page, product page, cart, or checkout that’s costing you the most customers.
⚡ KPI 3: AOV – Squeeze More Cash from Every Purchase
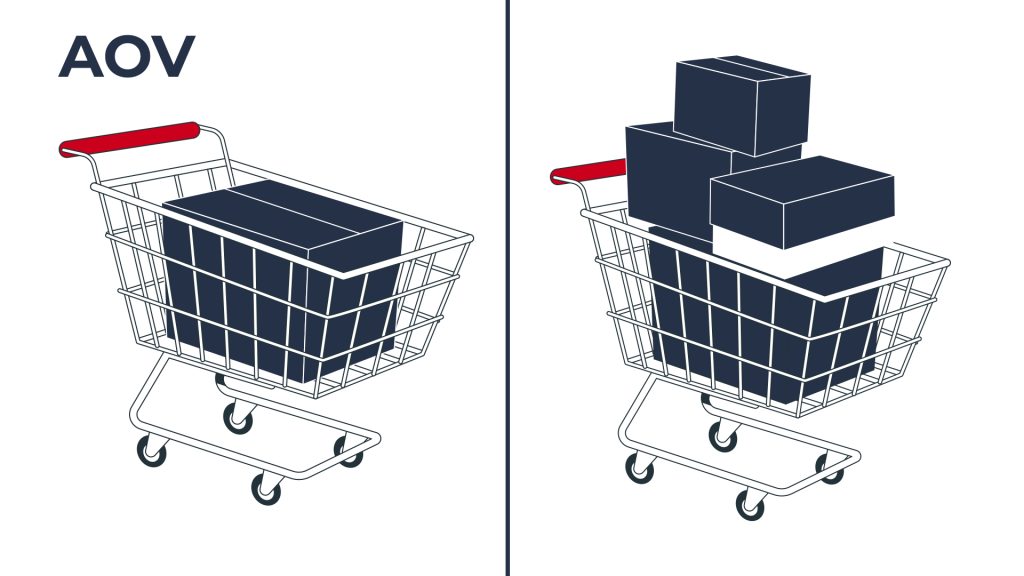
AOV (Average Order Value) is your secret weapon for increasing revenue without chasing new customers.
It’s how much each order brings in, on average. If you made $5,000 from 100 orders, your AOV is $50.
Why does it matter? Because when you crank up AOV, you make more money from the same traffic. Bigger returns, better margins and more ammo to dominate ads without sweating your ROAS.
Scaling gets way easier when you’re pocketing more per order. You can spend more to acquire a customer and still come out ahead.
Plus, it costs 5–10x more to snag a new buyer than to sell more to the one you’ve already got. So why not max out the value of every single purchase?
And here’s the kicker: repeat customers don’t just come back, they spend 67% more than newbies. That’s your hot zone for bundles, upsells, subscriptions and all the delicious profit plays.
Break Down AOV by Buyer Type
Don’t just look at your AOV as one big number. Slice it up by customer segment. This is because different buyers = different plays. And when you target right, you win big.
🛍️ One-Time Purchasers
They’re here for a hit-and-run. So, stack the cart before they purchase.
👉 Use bundles with the “buy more, save more” messaging. Tempt them with value-packed sets that make solo items look sad.
🔁 Returning Customers
They’re flirting with commitment. Time to turn that one-night stand into a subscription.
👉 Sweeten the pot. Offer a juicy freebie for subscribing that they can’t get with a regular order. It’s the nudge they need.
✍️ New Subscribers
They just joined so, make that first order count!
👉 Tier the gifts. Such as: “Get 2 gifts when you subscribe to the XL size and 3 gifts for XXL.”
👉 Let them pick delivery frequency too (30, 60, 90 days). Even if they scale back later, at least you received a higher upfront payment.
🔄 Loyal Subscribers
They’re steady, but don’t sleep on them. You can still boost their spend.
👉 Make upsells really easy. Let them add on items through email nudges or a slick subscription portal.
Quick Wins to Jack Up AOV
Want to pump your AOV today? Here are some fast wins:
- Bundles That Pop: Group products that make sense together, throw in a discount and boom: your customer has a bigger basket.
- Checkout Upsells: Hit them with a “Why not, upgrade for just $5?” moment right before they pay. Trust us, it works.
- Cross-Sells That Click: “Getting a laptop? Then you’ll need a case.” Add relevant recommendations before checkout.
- Free Shipping Triggers: Such as, “Spend $75 to get free shipping”. These work like magic because people love earning freebies!
AOV isn’t just a nice stat; it’s a profit lever. Pull it hard and you can outspend your competition, scale faster and build a business that doesn’t rely on squeezing every cent out of ad costs.
Don’t just try to cut expenses. Increase what each customer is worth. That’s how you grow smart, not desperate.
But let’s be real. With everything you’ve got on your plate, who’s got time to dig into the nitty-gritty of AOV strategies, segment breakdowns, and upsell flows?
That’s where Convert Like Crazy comes in. We do the heavy lifting, so you can focus on leading, growing and cashing in.
We’ll find the gold hiding in your current customers, crank up your AOV and help your funnel print more profit with every single order. Apply now to start converting like crazy!
⚡ KPI 4: Incremental Uplifts – The Small Wins That Stack Fat Profits
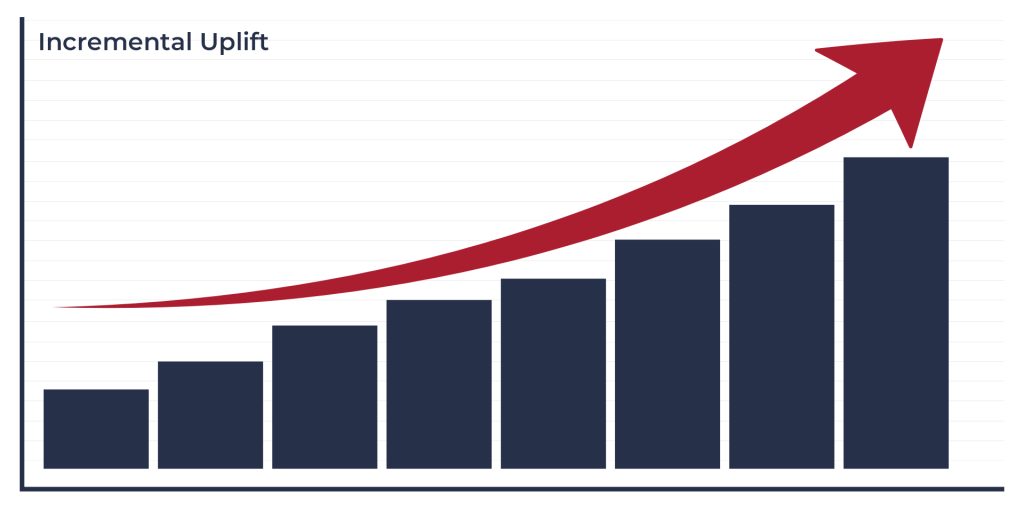
Everyone wants the big win. The sexy 100% lift that makes jaws drop.
But here’s the truth most business owners ignore: breakthrough growth isn’t built on one lucky swing… it’s stacked, brick by brick, through small, strategic tweaks.
That’s what we call incremental uplifts. Tiny changes. Measurable wins. Compound gains that snowball into revenue explosions.
You test a new CTA? +10%. Clean up your checkout form? +12%. Add effective social proof? + 5%.
Not just added. Multiplied. Because each win becomes your new baseline, your next launchpad.
So What Is an Incremental Uplift?
It’s the measurable boost you get when a new version of your page (headline, layout, offer, whatever) beats the old one. You run an A/B test, track RPV and revenue and pick the champ.
Then you lock in that winner. That becomes your new “normal.” And you run the next test from there.
Win, stack, repeat.
Think of It Like Climbing a Money Ladder
Each test is a rung higher. And unlike most ladders, this one prints cash.
Example time:
- Test 1: Page B beats Page A = +15% RPV
- Test 2: Page C beats B = +10% RPV
- Test 3: Page D adds social proof = +10% RPV
Add ’em up and you think it’s 35%. But nope. Compound that, and you’re looking at a 39.15% total uplift.
That’s more money. Same traffic. No extra spend. Just smarter moves.
Small Wins > Golden Unicorns
Everyone’s swinging for the fences. But the brands that scale? They’re smashing their revenue goals with constant, compounding wins.
If you don’t believe us, look at Amazon. They run experiments constantly on their site. Jeff Bezos famously said, “Our success at Amazon is a function of how many experiments we do per year, per month, per week, per day”.
Your incremental uplifts will get smaller and smaller until it becomes super hard to get an uplift. But each tiny tweak that moves the needle 1% has a big impact stacked together and before you know it, you’re on the path to skyrocketing your revenue.
This Works Everywhere.
Product pages. Checkout flows. Popups. Landing pages. If it’s on your site, it can be tested and lifted.
So stop chasing unicorn hacks. Start stacking proven wins.
Because the real growth? It’s hiding in the 4% lift you haven’t tested yet.
⚡ KPI 5: CAC & LTV – Go Right or Go Broke
You’ve dialled in RPV, boosted AOV and patched those funnel leaks. Great. But now it’s time to zoom out and ask the million-dollar question:
Is your funnel actually making you money long-term… or just racking up ad bills?
That’s where CAC and LTV drop the hammer.
What They Mean (& Why You Should Care)
- CAC (Customer Acquisition Cost): What it costs to get one new customer. Every dollar on ads, tools, salaries, agency retainers, it all goes in. Then you divide by new customers and you get your CAC.
- LTV (Customer Lifetime Value): The total cash you’ll squeeze from a customer over the full relationship. How often they buy, how much they spend. This is the real value of every buyer who walks through your virtual door.
Why CAC vs. LTV Is The Fight That Decides Your Future
If your CAC is anywhere near your LTV? You’re in trouble.
If CAC is higher than LTV? You’re basically lighting money on fire.
Let’s be blunt: no landing page magic can save you if you lose money every time you get a customer.
📉 Just ask Casper. $312M in revenue, but $114M burned on marketing and a $67M loss in 9 months because they weren’t making that ad spend back from each customer. The result? IPO fail.
A healthy business has around a 3:1 LTV-to-CAC ratio. For every $1 you spend, you’re pulling $3 back over time. That’s how you scale without sweating bullets.
Retention: The Real Moneymaker
Look, CAC isn’t just rising, it’s skyrocketing. One study showed it’s jumped 222% in 8 years. So yeah, you better make those hard-won customers stick around.
Why?
- Repeat customers cost 6–7x less to sell to
- They spend up to 67% more per order
- They actually like you (and that’s rare)
LTV isn’t fluff, it’s the growth engine. And retention is the fuel.
It All Connects: The Metrics You’ve Already Improved Make CAC & LTV Stronger
When you boost RPV and AOV, you earn more per visitor, making CAC easier to cover.
When you fix your drop-off rate? You convert more efficiently, dropping your effective CAC.
Stack it all together, and your customer economics go from shaky to bulletproof.
This is how you scale smart, not sloppy.
Better CAC. Higher LTV. Predictable profit. That’s the game.
And at Convert Like Crazy? We play to win, so you should probably apply to work with us right now.
⚡ Nail These KPIs, Dominate Your Growth
You’re already in the 7-figure game, now it’s time to scale smarter, faster and with way more firepower.
We’re talking RPV, Drop-Off, AOV, Incremental Uplifts, CAC & LTV, the real power metrics that fuel profitable growth.
Improve these and suddenly every visitor is worth more, every dollar works harder, and your campaigns hit like a knockout punch.
This is how modern brands scale. With data that drives action. With moves that print profit.
Track sharper. Test faster. Grow like hell.
And if you want a shortcut (because why wouldn’t you)? Let Convert Like Crazy run the playbook for you and turn your funnel into a revenue machine.